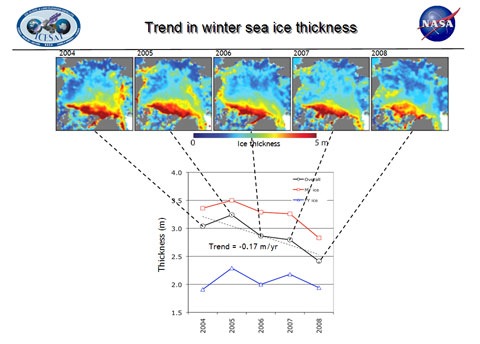
New analysis of Icesat data by a NASA team headed by Ron Kwok shows that from 2004 to 2008 Arctic winter sea ice “thinned dramatically”. Icesat measures the “freeboard” of the sea ice, the amount above water level. The graph below shows the extent of the decline, which is most marked in multi-year ice (ice that survives more than one summer).
[Click image for bigger version]
In 2003, 62 percent of the Arctic’s total ice volume was stored in multi-year ice, with 38 percent stored in first-year seasonal ice. By 2008, 68 percent of the total ice volume was first-year ice, with 32 percent multi-year.
The information on ice thickness is critical to understanding what’s going on in the Arctic, as Kwok notes:
“Ice volume allows us to calculate annual ice production and gives us an inventory of the freshwater and total ice mass stored in Arctic sea ice,” said Kwok. “Even in years when the overall extent of sea ice remains stable or grows slightly, the thickness and volume of the ice cover is continuing to decline, making the ice more vulnerable to continued shrinkage. Our data will help scientists better understand how fast the volume of Arctic ice is decreasing and how soon we might see a nearly ice-free Arctic in the summer.”
NASA also provide some very nice visualisations of the data: animations of the changes in autumn and winter ice thickness as well as still images. Well worth a look. For more about NASA’s work on thickness, check this earlier post.
Also well worth checking out: The Standard posts a report a lecture about Andrill and the West Antarctic ice sheet by Prof Tim Naish. Earlier in the week, the Herald also reported on a lecture by Prof Peter Barrett that covered similar ground. I’m hoping to persuade the good professors to provide more detail here sometime soon…
Like this:
Like Loading...

 Could New Zealand agriculture be part of the solution to climate change? We know all too well that it is part of the problem – and that’s not an accusation, by the way, just a recognition. But problems are there to be tackled, and what is called carbon farming looks like one way in which agriculture can substantially contribute to climate change mitigation and at the same time improve the soils on which it depends.